【国际动态】Melting conditions in the modern Tibetan crust since the Miocene
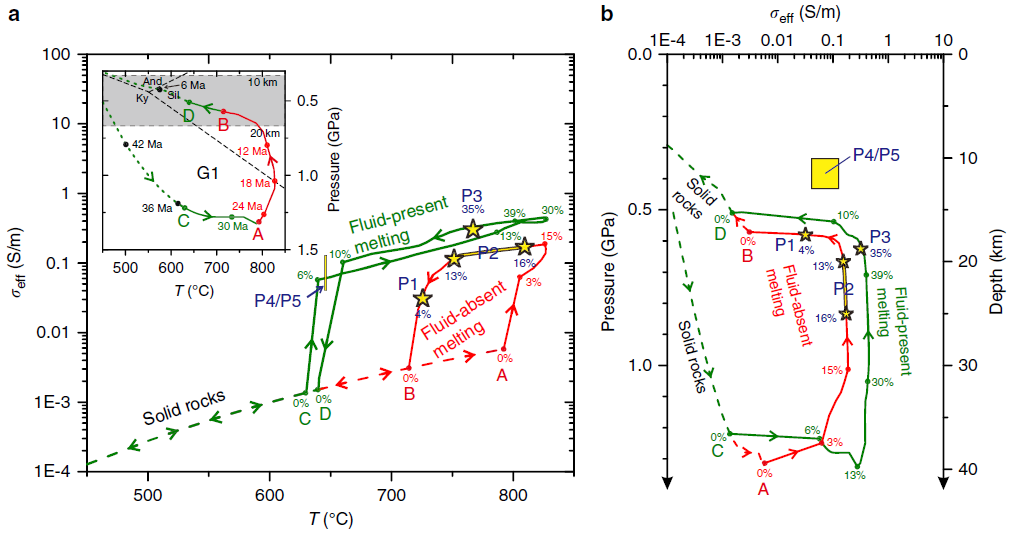
Fig. 3 The electrical conductivity (σeff)–pressure–temperature paths during burial and exhumation of Miocene Himalayan rocks compared with the conductivity of present-day Himalayan crust derived from MT data. a σeff along the P–T G1 path (inset diagram) as predicted by the “channel-flow model HT1”18 and metamorphic petrology31; the numbers in Ma on G1 path indicate the particle’s ages to the present. b Electrical conductivity vs. pressure or depth along the G1 path. The red path represents melt in the absence of excess water (i.e., fluid-absent melting, approximately dehydration melting) while the green path illustrates melting in the presence of excess water (i.e., fluid-present melting with excess water content of ca. 1.2%). Dashed curves indicate solid rocks (below solidus), while solid curves (i.e., the lines AB and CD) identify the partially molten domains. Green lines indicate fluid-present melting (AB), while the red lines refers to fluid-absent melting (CD). Arrows represent the direction followed during prograde and retrograde metamorphism along the G1 P–T path. The yellow stars and rectangles indicate the conductivity at P1–P3 and P4/P5 from the MT studies, respectively, and their sizes represent 30% uncertainty on the MT results. The percentage values on the curves represent the equilibrium melt fractions along G1, and the blue labels define the melt contents at P1–P3. The high conductivity spots (P1 and P2) are consistent with fluid-absent melting while P3 may correspond to fluid-present melting; alternative explanation for P3 are a local melt accumulation process or temperature being 100 °C warmer than those of the G1 P–T path.
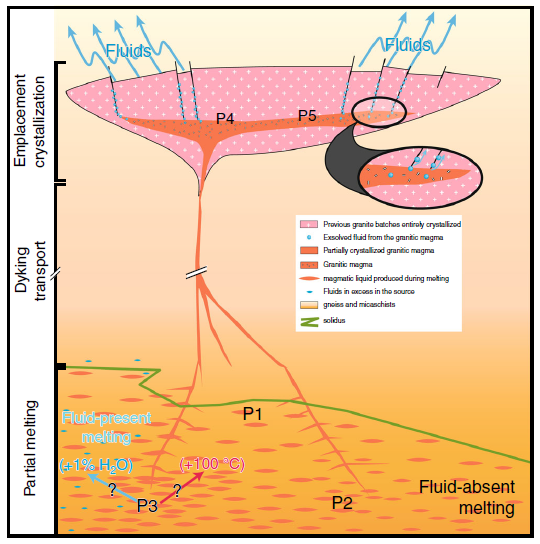
Fig. 4 Illustration linking P1–P5 MT anomalies to magmatic processes and crustal-scale transfer of water. The magmatic conditions at the P1–P5 electrical anomalies are given in Table 3. By these magmatic processes, water is transferred from the lower crust (depth >20 km), where partial melting occurs, to the emplacement/crystallization zone of granites (depth = ca. 10–12 km). Aqueous fluids released from solidifying granites may well significantly contribute to the numerous hot springs suggested from their geochemical features47. Fluid-absent melting under conditions similar to the G1 P–T path can explain the Northwestern Tibet, while beneath the Southern Tibet, either fluid-present melting or a warmer crust is required.
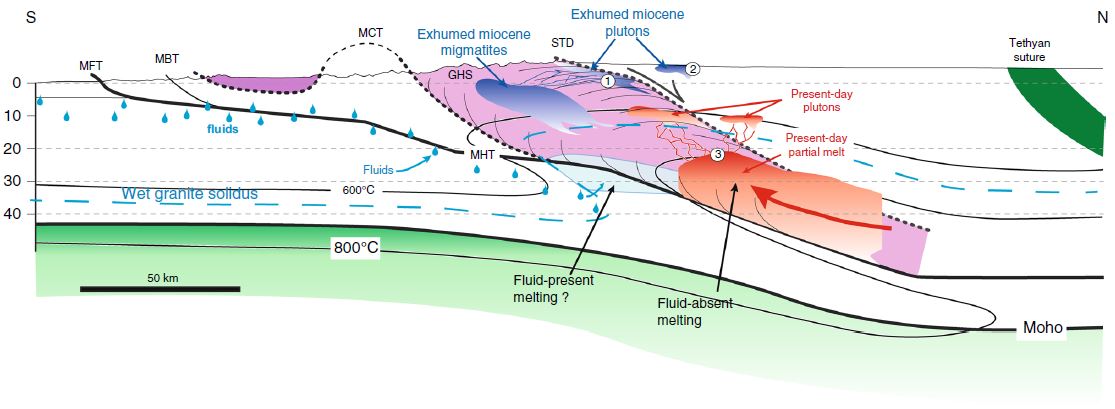
Fig. 5 Schematic diagram of granitic magma production, migration, and emplacement in a schematic cross-section of the Himalaya. The inactive shear zones (i.e., STD and MCT) are shown with bold dotted lines, while the active shear zones (i.e., MBT, MFT, and MHT) are shown as bold straight lines. The red regions identify the present-day location of partial melting plus melt ponding (present-day leucogranite plutons) while the blue areas are exhumed and solidified granitic rocks (migmatites and plutons). The numbers illustrate the emplacement of granitic plutons (1) below the STD or (2) above the STD while (3) refers to the top of the partial melting region from where the present-day dykes feeding the growing plutons are nucleating. The fluid identified by Rawat et al. is delineated by the blue droplets, south of the Main Frontal Thrust, and located within the Indian basement. Melting is obviously not occurring in the cold regions of the Indian basement, but this must represent a fluid-enriched zone that is buried beneath the chain. What happens to these fluids is not the kernel of this study but they may well contribute to the process of melting beneath Tibet.
文献来源:Jinyu, Chen, Fabrice Gaillard, Arnaud Villaros, et al. Melting conditions in the modern Tibetan crust since the Miocene [J]. Nature Communications, DOI: 10.1038/s41467-018-05934-7. (原文链接)
.png)

